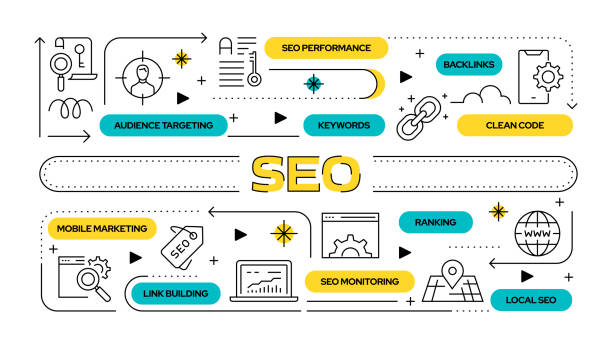
Free Rank Tracking and Performance Monitoring
Building a Custom Rank-Tracking Dashboard with Google Sheets and the Search Console API
If you’ve spent any time in the SEO trenches, you already know the drill: rank tracking tools are either absurdly expensive or laughably inaccurate. The paid platforms lock meaningful historical data behind subscription tiers, and the free ones give you cherry-picked snippets that mask the variance that actually matters. You don’t need another watered-down widget. What you need is a framework that lets you slice raw Google Search Console data on your terms, using tools you already trust—like a Google Sheet. This is not a beginner’s tutorial; it’s a blueprint for turning the Search Console API into a flexible, free rank-tracking engine that respects your time and intelligence.
The core insight is that Google Search Console’s performance report already contains position, impression, click, and CTR data for individual queries, pages, and devices—streamed from Google’s own servers. The constraint is its UI: you can only view aggregated tables or filter by a handful of dimensions before hitting invisible walls. By invoking the API directly, you bypass those limits. You can pull daily query-level data for arbitrary date ranges, with granularity down to the query+page combo, and store it in a spreadsheet where you can apply your own transforms, thresholds, and visualizations.
Here’s the architecture. You write a Google Apps Script (JavaScript, easily deployed inside any Sheet) that calls the `searchanalytics.query` method of the Webmasters v3 API. The endpoint accepts parameters for startDate, endDate, dimensions (e.g., query, page, device, country), rowLimit, and startRow for pagination. Because the API caps results at 25,000 rows per request, you will need to paginate through data for high-traffic sites—a nuance that many plug-and-play solutions gloss over. Your script loops through pages, appending rows until exhaustion, then dumps the data into a named sheet. Schedule this function to run daily (or weekly, depending on your freshness needs) using Apps Script’s built-in time-driven triggers.
The real payoff comes after ingestion. Instead of relying on a black-box tool’s “average position” metric, you can compute rolling seven-day averages, compare current versus previous period deltas, and flag queries that dropped below a certain position percentile. You can join this data with your own metadata—like targeted keyword clusters, content types, or campaign tags—using VLOOKUPs or array formulas. Want to see how your tier-one keywords fared after a core update? Filter by date range, sort by impression drop, and overlay your manual annotations. No vendor lock-in, no “data as a service” upcharge.
But caveats exist, and ignoring them would insult your expertise. The Search Console API reports aggregated session data, not true per-user rank tracking. Positions are based on the average of all displays across sessions and device types for a given query-page combination. This means you won’t see the daily rank volatility that a real-time rank checker provides. However, for strategic monitoring—trending direction, sustained shifts, and click elasticity—these averages are more robust than a single scrape point at noon. Additionally, the API has a three-day data freshness lag (finalized data appears after 48–72 hours), so yesterday’s numbers are never final. Build your dashboards with a 3- or 7-day delay to avoid chasing ghosts.
You also need to manage quota limits: 200,000 queries per day per property, which sounds generous until you request 30 days of query+page+device data for a site with 10,000 pages. Use smart sampling—focus on queries with at least a minimum impression threshold, or restrict dimensions to query-only unless you need page-level granularity. Pair your script with a caching layer: store daily snapshots in a separate sheet, and only pull fresh data when the trigger fires. This prevents re-querying historical ranges and conserves your API budget.
Finally, enhance the workflow with conditional formatting and sparklines. Highlight cells where CTR dropped more than 20% week-over-week. Use `SPARKLINE` functions to draw mini line charts of position trends over the last 30 days. Build a pivot table that aggregates by country or device, exposing gaps that you can address with technical fixes. This dashboard becomes a living, breathing analyst—not a static report.
You are not paying for a service; you are paying attention. The API is free, the spreadsheet is free, and the insights are yours to extract. Whether you are monitoring 50 keywords or 5,000, this approach scales without demanding a single credit card. It demands only that you understand data structures, API throttling, and the difference between variance and signal. If that sounds like work, you’re probably already enjoying it.